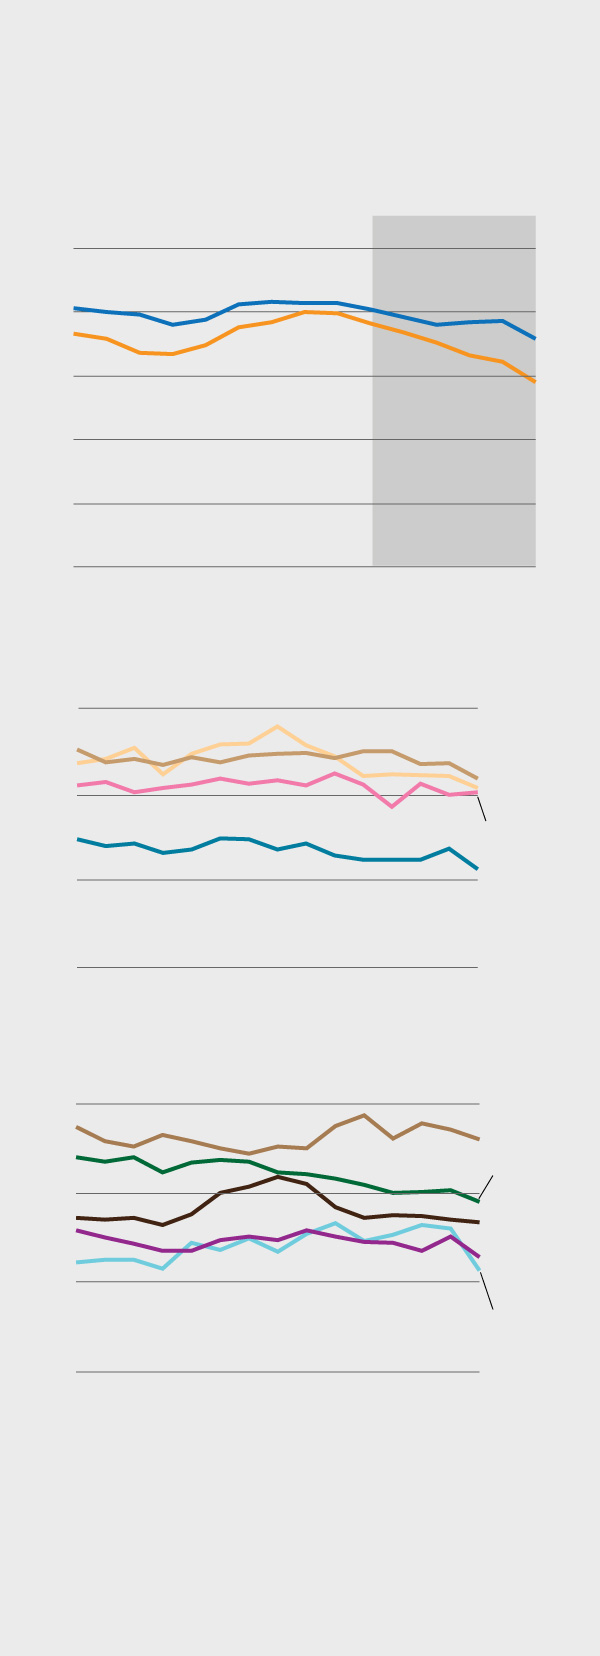
NYC poverty rate was declining
before the pandemic
Charts show the percent of population below the poverty line in New York City from 2005 to 2019
De Blasio’ s
term
25%
NYC
20
Official
15
10
5
0
2005
2010
2014
2019
Poverty rates by race and ethnicity
30%
Hispanic
Asian
20
Black
White
10
0
2005
2010
2014
2019
Poverty rates by borough
30%
Bronx
Brooklyn
20
Queens
Manhattan
10
Staten
Island
0
2005
2010
2014
2019
Note: NYC uses its own poverty measure,
which was any household earning less
than $36,262 in 2019 for a family of four.
The federal threshold that year was $25,926.
Source: Mayor's Office for Economic
Opportunity
SUHAIL BHAT / THE CITY
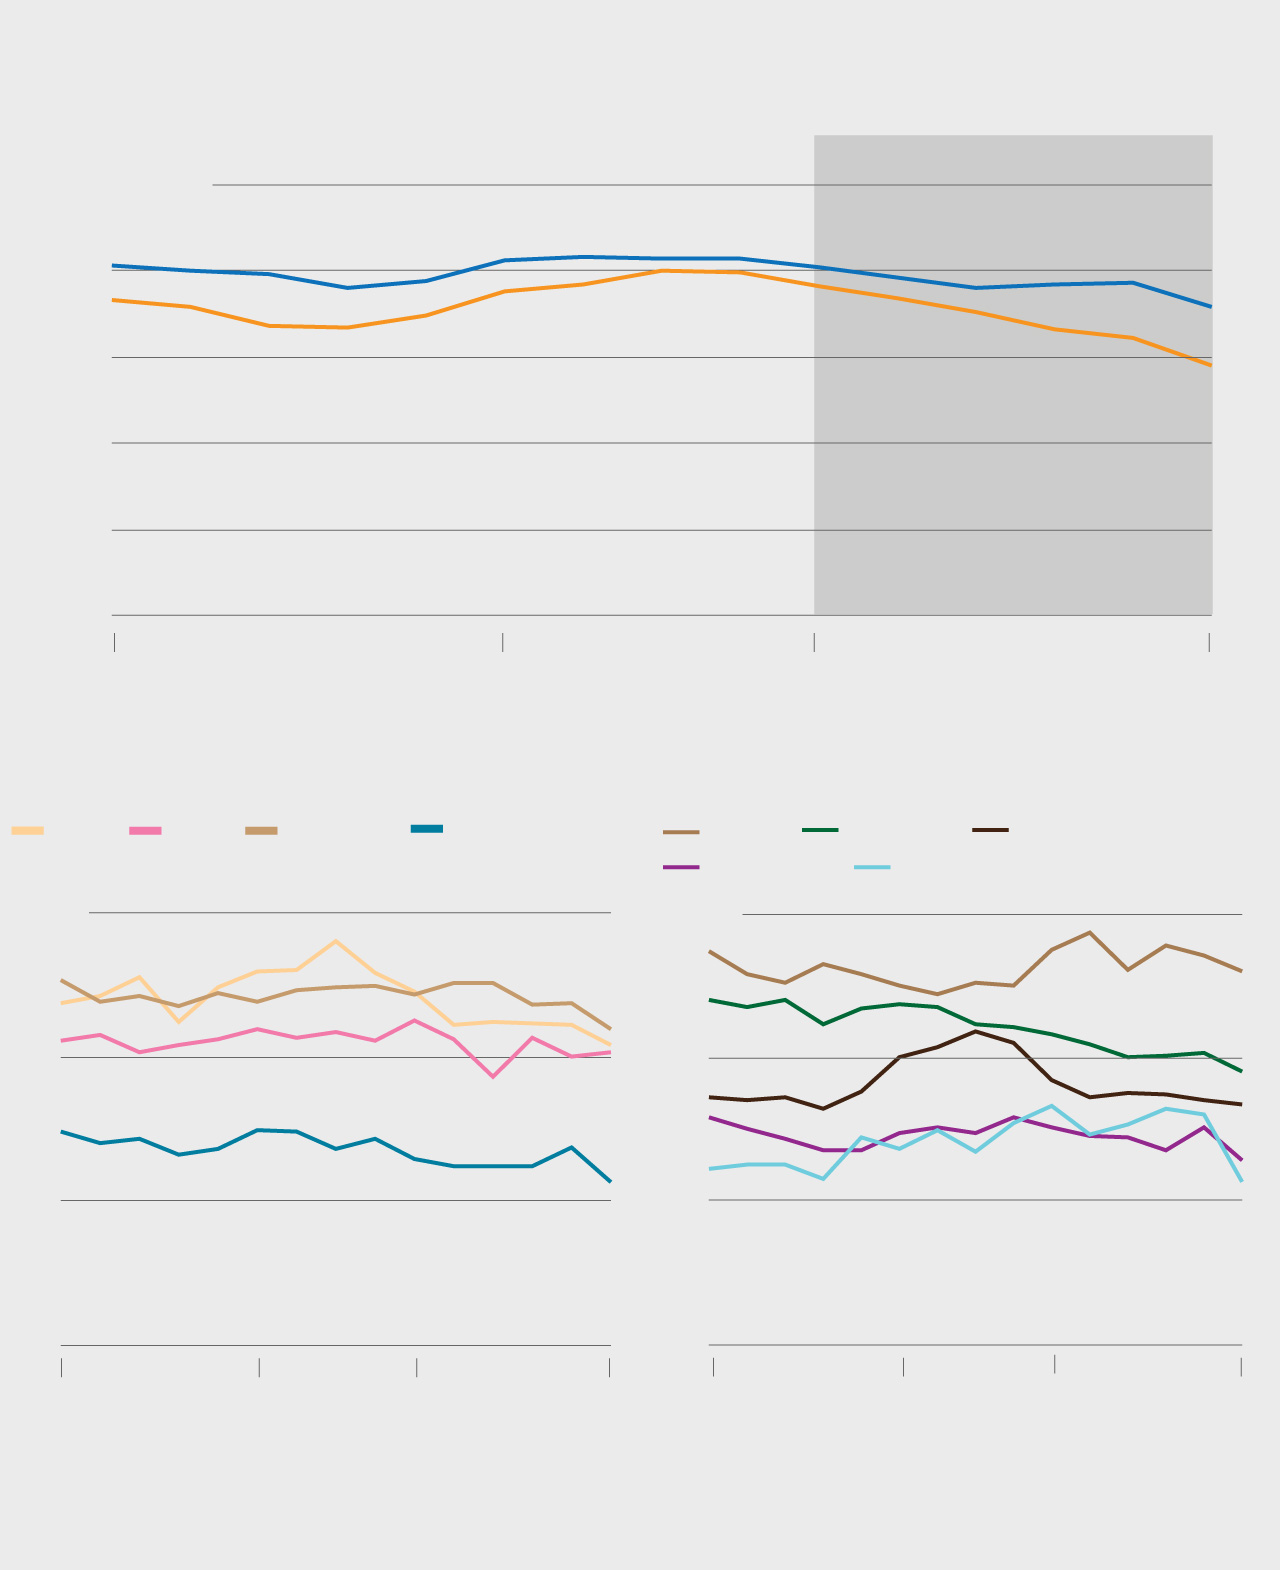
NYC poverty rate was declining before the pandemic
Charts show the percent of population below the poverty line in New York City from 2005 to 2019
De Blasio’ s term
25% people
NYC
20
Federal
15
10
5
0
2005
2014
2019
2010
Poverty rates by race and ethnicity
Poverty rates by borough
White
Bronx
Brooklyn
Queens
Asian
Black
Hispanic
Manhattan
Staten Island
30%
30%
20
20
10
10
0
0
2005
2010
2014
2019
2005
2010
2014
2019
Note: NYC uses its own poverty measure, which was any household earning less
than $36,262 in 2019 for a family of four. The federal threshold that year was $25,926.
Source: Mayor's Office for Economic Opportunity
SUHAIL BHAT / THE CITY